


NUTRITIVE VALUE OF EVALUTION OF ALOE VERA BASED PRODUCTS/h1>
Dr.Vinita Singh*, Shubhra Mishra
*Assistant Professor , Department of food science & Nutrition CSA University of Agriculture & Technology, Kanpur
E-mail: svinita2008@gmail.com
ABSTRACT
Aloe vera is the oldest medicinal plant ever known and the most applied medicinal plant worldwide. The first written records about the use of Aloe vera were found on over 6,000 years old clay tablets found in Mesopotamia.In recent years, considerable progress has been made in pharmacological research on Aloe vera and there has appeared in the market some aloe food, medicine, health care products and cosmetics, which seems to be very popular. Hence, the study was taken up to formulate food products like jams, laddus by adding Aloe vera. The samples prepared were analyzed for nutritional constituents using standard procedures (AOAC,1995). Aloe vera Laddus contained 34.21%, 39.52% and 45.91% moisture on D1, D2 and D3 respectively. The mean scores of protein content in samples of laddus were 6.02%, 5.06% and 4.11% on D1, D2 and D3 respectively. The mean score of Aloe veraladdus for fat were 17.82%, 16.40% and 15.28% on D1, D2 and D3 respectively. The mean score of carbohydrate content in Aloe vera laddus were 23.23%, 22.15% and 20.12% on D1, D2 and D3 respectively. The mean score of crude fibre content in Aloe vera laddus were 7.49%, 6.42% and 5.32% on D1, D2 and D3 respectively. Aloe vera jam contained 45.93%, 45.95% and 45.98% moisture on D1, D2 and D3 respectively. The mean scores of protein content in samples of jam were 5.03%, 5.06% and 5.09% on D1, D2 and D3 respectively. The mean score of fat content in Aloe vera jam was 3.2% on D1, D2 and D3. The mean score of carbohydrate content in Aloe vera jam was 25.89%, 27.83% and 27.90% on D1, D2 and D3 respectively. The mean score of crude fibre content in Aloe vera jam was 12.7%, 12.60% and 12.55% on D1, D2 and D3 respectively. Inclusion of such products in the diet of an individual can help in providing nourishment as well as the therapeutic benefits of Aloe, especially for its laxative and hypoglycaemic effect.
Keywords: Aloe vera, Nutritive value, Laxative and hypoglycaemic effect
INTRODUCTION
Medicinal plants have been used to treat ailments and promote health, since before recorded history. Aloe vera is only now coming of age. Aloe vera has a great value in the society. Aloe vera is most commonly used in making cosmetics and some medicines. But very few attempts have been made to process Aloe vera into food products. The most available product of the Aloe vera available in India is Aloe vera Juice. Hence, the study was taken up to make food products of Aloe vera and make it available. Aloe vera has very good nutritional composition. It contains 20 of the 22 Amino acids required for good nutrition. Aloe vera has shown to contain 13 of the 17 minerals required in the body, namely, calcium, potassium, phosphorus, sodium, chlorine, aluminium, magnesium, manganese, selenium, silicon, zinc and cobalt. It has been proved that aloe vera has more than 160 chemical compositions, among which 72 are functional, such as anthraquinone compounds, polysaccharides, glucoside, lipid, organic acids, enzymes, amino acids, antibiotics etc.
The present study was carried out in the Department of Food Science and Nutrition, M.A.B. College of Home Science, C.S. Azad University of Agriculture and Technology, Kanpur.
OBJECTIVES OF THE STUDY
To formulate the products namely jams and laddus using Aloe vera.
To conduct the sensory evaluation of the products formulated and to assess their nutritive value on 3rd ,6th and 9th day.
RESEARCH METHODOLOGY
Development of products
Preparation of Aloe vera laddus: Aloe vera laddus were prepared using rava.
Method:
Aloe vera pulp was taken and roasted on low medium flame in melted ghee till brown colour appear.
Sugar, dry fruits and roasted rawa were added in it.
Balls were made into desired size.
Stored in air tight container.
- Preparation of Aloe vera jam:
Method:
Aloe vera pulp was extracted and soaked in the solution of citric acid for 15 minutes.
Aloe vera pulp was crushed using blender.
Sugar and jelly powder was added to them and cooked till the texture softened. The mixture was allowed to stand for half an hour.
Then the mixture was cooked on quick fire. Continuous stirring was followed to avoid burning. The mass was cooked until desired consistency was obtained.
The end point was tested by drop test.
Jam was filled in dry sterilized wide mouth bottle while hot.
Nutritional Evaluation of Prepared Products
The prepared samples were analysed for nutritive value as moisture, protein, fat, carbohydrate, fiber and ash using standard procedure.
Stastical analysis
The data obtained in the present investigation were tabulated statistically by using CRD (Completely Randomized Design).
RESEARCH FINDINGS AND SUGGESTION
1. Mean score of nutritional evaluation of Aloe vera laddus:
The data of mean score were tabulated and analyzed statistically; results and discussion has been presented in Table 1.
Moisture Profile:
It is evident from the table 1 that Aloe vera Laddus contain 34.21%, 39.52% and 45.91% moisture on D1, D2 and D3 respectively. Moisture content is important for the shelf life study.
Protein Profile:
The mean scores of protein content in samples of laddus were 6.02%, 5.06% and 4.11% on D1, D2 and D3 respectively as shown in table 1. Table shows that the protein content of the product was decreased as the storage days were increased.
Table 1: Mean Score of nutritional evaluation of Aloe vera Laddus.
(In per 100g)
NOTE: D1: 3rd day D2: 6th day D3: 9th day
Fat Profile:
Table 1 shows that the mean score of Aloe vera laddus for Fat were 17.82%, 16.40% and 15.28% on D1, D2 and D3 respectively. A perusal data presented in the table indicates that the fat content of laddus was decreased slightly after different days.
Carbohydrate Profile:
Table 1 indicates that the mean score of carbohydrate content in Aloe vera laddus were 23.23%, 22.15% and 20.12% on D1, D2 and D3 respectively. Table reveals that the carbohydrate content of laddus were decreased after different days.
Crude Fibre Profile:
It is evident from the table 1 that the mean score of crude fibre content in Aloe vera laddus were 7.49%, 6.42% and 5.32% on D1, D2 and D3 respectively. The above table shows that the Aloe vera laddus were non significant at 5% critical difference.
Total Ash Profile:
Table 1 shows that mean score of Table indicates that there were slight differences in total ash after different storage days.
2. Mean score of nutritional evaluation of Aloe vera jam:
The data of mean score were tabulated and analyzed statistically; results and discussion has been presented in Table 2.
Moisture Profile:
It is evident from the table 2 that Aloe vera jam contains 45.93%, 45.95% and 45.98% moisture on D1, D2 and D3 respectively. Moisture content is important for the shelf life study.
Protein Profile:
The mean scores of protein content in samples of jam were 5.03%, 5.06% and 5.09% on D1, D2 and D3 respectively as shown in table 2. Table shows that the protein content of the product was increased slightly as the storage days were increased.
Table 2: Mean Score of nutritional evaluation of Aloe vera Jam. (In per 100g)
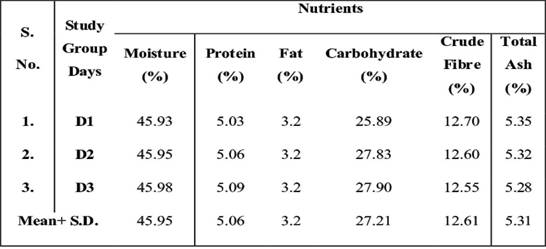
NOTE: D1: 3rd day D2: 6th day D3: 9th day
Fat Profile:
Table 2 shows that the mean score of Aloe vera jam was 3.2% on D1, D2 and D3. A perusal data presented in the table indicates that the fat content of jam had no change after different days.
Carbohydrate Profile:
Table 2 indicates that the mean score of carbohydrate content in Aloe vera jam was 25.89%, 27.83% and 27.90% on D1, D2 and D3 respectively. Table reveals that the carbohydrate content of jam was increased after different days.
Crude Fibre Profile:
It is evident from the table 2 that the mean score of crude fibre content in Aloe vera jam was 12.7%, 12.60% and 12.55% on D1, D2 and D3 respectively. The table 2 shows that the Aloe vera jam was decreased after storage days.
Total Ash Profile:
Table 2 shows that mean score of total ash content in Aloe vera jam were 5.35%, 5.32% and 5.28% on D1, D2 and D3 respectively. Table indicates that there were slight differences in total ash after different storage days.
CONCLUSION
On the whole, Aloe vera is a nutritious plant with various health benefits. Aloe vera products are safe for consumption and the shelf life of the product is excellent. The inclusion of Aloe vera products in the diet of an individual can add to the diet's nutritive and therapeutic value. It plays an important role in gerontology and rejuvenation. Aloe Vera is full of medicinal properties & it is effective in treating various body ailments. Hence measures should be taken to create awareness about aloe vera products among people to include it in their diet.
REFERENCES
Choo, C. (2003). Vital Vera, Asia Pacific Food Industry. 15 (60) : 36-37.
Gautam, S. and Awasthi, P. (2007). Nutrient composition and physiochemical characteristics of Aloe vera (Aloe barbadensis) powder. J. Food Sci. Technol. 44 (2) : 224-225.
Neall, B. (2004). Aloe's new role in functional foods. Food Review. 31 (2) : 24-25.
Paul, S. (2003). Aloe vera : A review of chemical constituents. J. Pharm. Pharmacol. 58 : 30-35.
![]()
Article Information
Sr No: 12
Page No: 65-68
Size:
Download:
Cited By:
Language: English
Licence: IJW
Authors: Dr.Vinita Singh*, Shubhra Mishra
Authors Address: *Assistant Professor , Department of food science & Nutrition CSA University of Agriculture & Technology, Kanpur
Email: svinita2008@gmail.com
Published: 14 November, 2014
DEVELOPMENT AND EVALUATION OF NUTRITIONAL QUALITY OF ANTIOXIDANT RICH PRODUCTS USING DRUMSTICK (Moringa oleifera) AND AMARANTH (Amaranthus tricolor) LEAVES POWDER
Shalini Kushwaha*, Paramjit Chawla**
*Assistant Professor, Department of Food Science and Technology Babasaheb Bhimrao Ambedkar University, Lucknow-226002
**Professor, Department of Food and Nutrition, Punjab Agricultural University, Ludhiana
Email: shalinikushwaha72@gmail.com Contact no. 09956784221
ABSTRACT
Drumstick (Moringa oleifera) and amaranth (Amaranthus tricolor) leaves are rich source of protein, b- carotene, ascorbic acid and minerals. The aim of the present study was to standardize and organoleptically evaluate drumstick leaves powder (DLP) and amaranth leaves powder (ALP) incorporated recipes with their nutritional evaluation. Products namely dal, pulao and khichri at 25% and 30% level were prepared by incorporating these powders and control. Proximate analysis and vitamin content of products were estimated. Results showed that 25% level of supplementation in dal, pulao and khichri were highly acceptable, with an overall acceptability score of 7.65 (25% DLP) and 7.37 (25% ALP) for dal and 8.20 (25% DLP) and 7.52 (25% ALP) for pulao whereas 8.05 (25% DLP) and 7.87 (25% ALP) for khichri. Dal supplemented at 25% level of DLP had 21.40% protein, 6.92% crude fat, 5.34% crude fibre, 3.65% total ash and 398Kcal energy whereas dal with 25% ALP had 21.20% crude protein, 6.32% crude fat, 4.02% crude fibre, 4.63% total ash and 397 Kcal energy. Pulao supplemented at 25% level of DLP had 10.84% protein, 6.52% crude fat, 4.39% crude fibre, 3.02% total ash and 402Kcal energy whereas pulao with 25% ALP had 9.23% crude protein, 6.01% crude fat, 3.14% crude fibre, 4.10% total ash and 401 Kcal energy. Khichri supplemented at 25% level of DLP had 11.53% protein, 5.62% crude fat, 4.46% crude fibre, 3.59% total ash and 395Kcal energy whereas khichri with 25% ALP had 11.42% crude protein, 5.05% crude fat, 3.21% crude fibre, 4.57% total ash and 394 Kcal energy. These results reveal that the leaves contain an appreciable amount of nutrients and can be included in diets to supplement our daily nutrient needs.
Keywords: Amaranth leaves powder, Drumstick leaves powder, Nutritional evaluation
INTRODUCTION
Balanced diets are not accessible to a large population of the world, particularly those in developing countries. Maximum population in developing countries is affected by malnutrition and micronutrients deficiency. In India, malnutrition is a major nutritional problem. Micronutrients malnutrition poses a serious threat to the health of vulnerable groups of population. Among the plant foods green leafy vegetables are the cheapest and locally available food rich in micronutrients (Singh et al 2007) Drumstick (Moringa oleifera) is an extremely valuable medicinal plant, distributed in the tropics and subtropics regions. Various parts of this plant contain protein, vitamins, b-carotene, amino acids, important minerals and various phenolic compounds (Patel et al 2010). Amaranth (Amaranthus tricolor) leaves are rich in protein, vitamins and mineral components (Shukla et al 2010). Keeping in view the nutritional value of drumstick and amaranth leaves, this study was planned to develop and evaluate antioxidant rich products from drumstick leaves and amaranth leaves powder.
MATERIALS AND METHODS
Fresh drumstick leaves and amaranth leaves were procured from Department of Vegetable Crops, Punjab Agricultural University, Ludhiana. Leaves were sorted and washed. Washed leaves were spread and dried in oven at 40°C for 4-6 hours and then powdered. Powdered drumstick leaves were named as Antioxidant powder I (DLP) and amaranth leaves as antioxidant powder II (ALP). All other ingredients were purchased from the local market. Products namely dal, pulao and khichri at 25% and 30% level were prepared by incorporating these powders. Control was also prepared. The samples with 25% and 30% level of antioxidant powder I were named D1 and D2 respectively whereas samples with 25% and 30% level of antioxidant powder II were named A1 and A2 respectively. The prepared products were evaluated thrice for their acceptability by a panel of 10 judges using Hedonic Rating Scale. Nutritional evaluation of products was performed by analysing proximate content (AOAC 1990) and vitamin C (AOVC 1996) and b-carotene (Rangana 1995).
RESULTS AND DISCUSSION
Organoleptic evaluation of antioxidant rich products
Dal
The mean scores of acceptability trials of dal are presented in Table 1. Five samples of dal were prepared using chana dal as control and for test sample chana dal was supplemented with antioxidant powder I (DLP) and antioxidant powder II (ALP), at 25% and 30% levels. The samples with 25% and 30% level of antioxidant powder I were named D1 and D2 respectively whereas samples with 25% and 30% level of antioxidant powder II were named A1 and A2 respectively. Colour of D1 was liked very much with highest score (7.65) followed by D2 (7.30). Products supplemented with ALP had lower scores. The highest mean score for appearance was 7.70 for D1 and 7.30 for A1 followed by D2 (7.45) and A2 (7.20). The mean scores for flavour varied between 7.25to 7.55 and were higher for D1 scored 7.55 and A1 scored 7.40 respectively. D2 and A2 scored 7.25 which was liked very much. Sample D1 and A1 scored highest i.e. 7.80 and 7.30 respectively for texture and liked very much. The highest score for taste was obtained by D1 (7.40) and A1 (7.35) which was liked moderately followed by D2, A2. The mean scores for an overall acceptability for D1 was 7.65 and A1 was 7.37 which was liked very much. Control had significantly (p≤0.05) higher scores than that of other samples of antioxidant powder I and II. Dal at 25% level of supplementation of drumstick leaves powder and amaranth leaves powder were found to be highly acceptable. Pant (2011) reported 40% drumstick leaves supplemented Kabuli chana was liked slightly and showed significant difference with 25% supplementation in all the attributes thus resulting loss in the sensory qualities with increase in the level of supplementation.
Pulao
The mean scores of acceptability trials of pulao are presented in Table 1. Five samples of pulao were prepared using rice as control and for test sample rice was supplemented with antioxidant powder I (DLP) and antioxidant powder II (ALP) each at 25% and 30% level. The samples with 25% and 30% level of antioxidant powder I were named D1 and D2 respectively whereas samples with 25% and 30% level of antioxidant powder II were named A1 and A2 respectively. The mean score of colour for D1 was 8.15 which was liked very much while A1 scored 7.50. The highest mean score for appearance was 8.20 for D1 and 7.75 for A1 which was liked very much followed by D2 (7.50) and A2 (6.95). A significant difference for colour and appearance was observed for A1 and A2 while significant difference for appearance was observed for D1 and D2. The mean scores for flavour varied between 8.15 to 6.80 and were higher for D1(8.15) and A1 (7.60). Sample D1 scored highest i.e. 8.20 and A1scored 7.55 for texture feel. A significant difference for flavour and texture was observed for 25% ALP supplemented sample A1 and 30% ALP supplemented sample A2. The highest score for taste was obtained by
D1 (8.20) and A1 (7.55) followed by D2 (7.60) and A2 (6.90) both liked moderately. The mean scores for an overall acceptability for D1 was 8.20 which was liked very much and 7.52 for A1 which was liked moderately. A
significant (p≤0.05) difference for taste and an overall acceptability was observed among all the levels. Controlhave significantly higher scores than that of other samples of antioxidant powder I and II. Supplementation at 25% level of drumstick leaves powder and amaranth leaves powder were found to be highly acceptable among different levels. Kaur and Kochar (2009) reported that overall acceptability of pulao ranged from 5.60 to 6.40 after incorporation of 60 per cent fresh as well as dry carrot greens.
Khichri
The mean scores of acceptability trials of khichri are presented in Table 1. Five samples of khichri were prepared using rice and dal as control and for test sample rice and dal was supplemented with antioxidant powder I (DLP) and antioxidant powder II (ALP) each at 25% and 30% level. The samples with 25% and 30% level of antioxidant powder I were named D1 and D2, respectively whereas samples with 25% and 30% level of antioxidant powder II were named A1 and A2 respectively. The mean score of colour for D1 and A1 was 7.80 and 8.10 which was liked very much. The highest mean score for appearance was 8.20 for A1 which was comparable with control and 7.90 for D1 which was liked very much followed by D2 (30% DLP) and A2 (30% ALP). A significant (p≤0.05) difference for colour and appearance was observed for all the sample. The mean scores for flavour varied between 8.10 to 7.40 and were higher for A1(8.10) and D1(7.75) which was liked very much. Sample D2 and A2 scored highest i.e. 8.00 and 7.75 respectively for texture feel and liked very much. A significant (p≤0.05) difference for texture was observed for A1, A2 . The highest score for taste was obtained by D1 (7.90) and A1 (8.00) which was liked very much followed by A2, D2 both liked moderately. The mean scores for an overall acceptability for D1 was 8.05 and A1 was 7.87 which was liked very much. No significant (p≤0.05) difference was observed between control and D1 (25% antioxidant powder II) in an overall acceptability. Control have significantly (p≤0.05) higher scores than that of other samples of antioxidant powder I and II. Supplementation at 25% level of drumstick leaves powder and amaranth leaves powder were found to be highly acceptable among different levels.
Proximate composition of antioxidant rich products (dry weight basis)
Dal
It was observed that the moisture content of dal (Table 2) ranged between 1.75-2.56 per cent being maximum as 2.56% in D2 (30% DLP) followed by 2.36% in A2 (30% ALP), 1.93% in D1 (25% DLP) and 1.75% in control. Significant difference was observed in moisture content among different products. Significantly higher protein content was observed in D2 as compared to A1 with protein content 22.86 and 21.59 per cent respectively. Pant (2011) reported protein content in kabuli chana prepared at 25% level of fresh drumstick leaves as 19%. The fat content was found to be in the range of 6.05% for control followed by 6.32% for A1 and 6.45% for A2 product. The fibre content was observed to be minimum 1.09% for control and maximum 6.19% for D2, followed by 5.34% for D1 products. The difference was found to be statistically significant (p>0.05). Total ash content was found maximum 5.10% for A2, followed by 4.63% for A1 and minimum 2.13% for control product. Puniaet al (2004) reported 9.61 and 9.86g/100g ash content in kondhara leaves supplemented bengal gram dhal and green gram dhal respectively. The highest amount of carbohydrates was found in control as 74.51g, followed by 63.83g and 62.69g for A1 and D1 product respectively. The energy content was found to be in the range of 393-417 Kcal per 100g.
Pulao
The data in Table 2 revealed that moisture content of pulao ranged from 2.51 for control 3.74% for D2 product (30% DLP) with statistically significant (p>0.05) difference. The protein content was maximum in product D2 as 11.20% followed by A2 (30% ALP) as 11.02%. Pant (2011) reported protein content of vegetable poha supplemented with 25% level of fresh drumstick leaves as 5.95%. The fat content of pulao ranged from 5.70% for control to maximum 6.72 for D2 followed by D1 (6.52) and A2 (6.01). The fibre content of pulao ranged from 0.14% for control to maximum 5.24 % for D2 followed by 4.39% for D1. The ash content of pulao ranged from 1.50% for control to 4.60% for A2. The differences in moisture, crude protein, crude fat and total ash were found to be statistically significant (p>0.05) in different levels of pulao. The carbohydrate content of the control was 87.46% and 73.54% for D2. The energy content of control was found to be 402 Kcal/100g for D1,
401Kcal/100g for A1, 399Kcal/100g for D2 product.
Khichri
Results depicted in Table 2 revealed that the moisture content of khichri prepared from 30% drumstick leaves powder was 2.90% as compared to 2.48 and 1.73 per cent of A2 (30% ALP) and control respectively. Significantly higher protein content was observed in khichri in D2 (30% DLP) product as compared to A2 with protein content 12.71 and 12.59 per cent respectively. The fat content was found to be in the range of 4.75% for control followed by 5.05% for A1 (25% ALP) and 5.12% for A2 (30% ALP) product. The fibre content was observed to be minimum 0.21% for control and maximum 5.31 for D2, followed by 4.46% for D1 products. The difference was found to be statistically significant (p>0.05). Total ash content was found maximum 5.02% for A2, followed by 4.57% for A1 and minimum 2.07% for control product. Pant (2011) reported ash content of vegetable poha supplemented with 25% level of fresh drumstick leaves as 1.75%. The highest amount of carbohydrates was found in control as 86.31%, followed by 75.75% and 74.80% for A1 and D1 product respectively. The energy content was found to be in the range of 380-414 Kcal per 100g.
Vitamin content of antioxidant rich products
Ascorbic Acid
The results presented in Table 3 revealed that among all the antioxidant rich products vitamin C content of D2 (30% DLP) pulao was highest as 180.32mg/100g and lowest in control dal as 1.05 mg/100g. It was observed that ascorbic acid content of dal prepared from 30% drumstick leaves powder (D2) was 174.28mg while 54.31mg for 30% amaranth leaves powder (A2). Control had lowest ascorbic acid content of 1.05mg. Maximum ascorbic acid content of pulao was found in D2 (30% DLP) as 180.32mg followed by D1 (25% DLP) as 149.05mg. A1 (25%ALP) was found to contain 44.38mg and A2 (30%ALP) as 50.80mg of ascorbic acid. It was observed that vitamin C content of khichri was maximum for D2 (30%DLP) as 177.30mg followed by D1(25%DLP). Minimum ascorbic acid content was observed in control as 1.8mg. A statistically significant (p≤0.05) difference was observed between different levels of dal, pulao and khichri prepared from antioxidant powder I and II. Singhi (2007) reported an ascorbic acid content of 7.69 and 11.14 mg/100g in missi paratha and kabuli chana respectively with cauliflower leaf powder supplementation. Brar (2009) reported 6.34 and 3.2 mg/100g ascorbic acid content in mathi and bhujia mix respectively with colocasia leaf powder supplementation.
b-carotene
The results presented in Table 3 revealed that b-carotene content of D2 (30% DLP) dal was highest as 26897µg/100g and lowest in control pulao as 0.04µg/100g. Dal, pulao and khichri were prepared at 25% and 30% level of supplementation with DLP and ALP. It was observed that b-carotene content of dal D2 had maximum b-carotene content as 26897µg/100g followed by D1 as 21794 µg/100g. A2 was found to contain 6672µg/100g of b-carotene while A1 as 5847µg/100g. Maximum b-carotene content of pulao was observed in D2 as 24897µg/100g followed by D1 as 21239µg/100g. A1 was found to contain 6345µg/100g and A2 as 6724µg/100g of b-carotene. It was observed that b-carotene content of khichri was maximum for D2 as 25839µg/100g followed by D1 as 21674µg/100g and A2 as 8789µg/100g. A statistically significant (p≤0.05) difference was observed in dal, pulao and khichri prepared at different levels from antioxidant powder I and II. Singhi (2007) reported 2010 and 1946µg b-carotene per 100g of kabuli channa and missi paratha prepared from cauliflower leaf powder. Brar (2009) reported a lower b-carotene content of 4071 and 1391µg per 100g in colocasia leaf powder supplemented mathi and bhujia mix. Beta carotene content in pulao increased with incorporation of 60 per cent level of fresh as well as dry carrot greens (Kaur and Kochar 2009).
This study revealed that dal, pulao and khichri at 25% level of supplementation of drumstick leaves powder and amaranth leaves powder were highly acceptable. Products with higher level of supplementation of DLP and ALP had decreased acceptability scores due to bitter taste and flavor because of polyphenols. Supplementation of drumstick leaves powder and amaranth leaves powder significantly increases protein, fibre and vitamin content of the supplemented products as compared to control. Consumption of drumstick leaves
powder and amaranth leaves powder supplemented products should be encouraged as it helps to improve nutritional status and could be easily included in daily diet.
LITERATURE CITED
AOAC 1990.Official methods of Analysis 14th ed. Association of Official Analytical Chemist, Washington, DC.
AOVC 1996. Methods of vitamin assay. Association of vitamin chemists Inc.(ed.) Interscience Publishers, pp 306-12.
Brar N 2009.Dietary approaches to enhance the nutrient availability from supplementary foods. M.Sc.thesis, Punjab Agricultural University, Ludhiana.
Kaur TJ and Kochar GK 2009. Development and sensory evaluation of beta carotene rich food preparations using Underexploited carrot greens. J Hum Ecol 28(3): 207-12.
Pant R 2011. Development and nutritional evaluation of value added cereal pulse based products using drumstick leaves (Moringa oleifera).M.Sc. thesis, Punjab Agricultural University Ludhiana.
Patel S, Thakur AS, Chandy A and Manigauha A 2010.Moringaoleifera: A review of there medicinal and economical importance to the health and nation. Drug Intervention Today 2(7):339-342.
Punia D, Yadav SK, Gupta M and Khetarpaul N 2004 Nutrient composition of Amaranth (Amaranthus tricolor) and Kondhara (Digeriaarvensis) leaves and their products. J Food SciTechn 41(5):563-66.
Rangana S 1995. Handbook of analysis and quality control for fruit and vegetable products. Tata Mc Graw Hill Publishing Company Limited, New Delhi.
Shukla S, Bhargava A, Chatterjee A, Pandey AC and Mishra BK 2010.Diversity in phenotypic and nutritional traits in vegetable amaranth (Amaranthus tricolor), a nutritionally underutilized crop.J Sci Food Agric 90:139-144.
Singh L,YadavN,Kumar A R, Gupta A K, Chacko J, Parvin K and Tripathi U 2007. Preparation of value added products from dehydrated bathua leaves (Chenopodium album Linn.). Natural Product Radiance 6(1):6- 10.
Singhi H 2007.Nutritional evaluation of value added b-carotene and iron rich products. MSc. Thesis, Punjab Agricultural University, Ludhiana, India.
Table 1. Organoleptic scores of antioxidant rich products (Mean ± SE)
Dal
Sample Acceptability |
Colour Appearance Flavour Texture Feel Taste Overall |
|||||
Control |
8.40±0.13 |
8.35±0.14 |
8.40±0.12 |
8.35±0.12 |
8.35±0.14 |
8.52±0.13 |
D1 |
7.65±0.26 |
7.70±0.26 |
7.55±0.27 |
7.80±0.29 |
7.40±0.35 |
7.65±0.29 |
D2 |
7.30±0.26 |
7.45±0.25 |
7.25±0.25 |
7.30±0.28 |
7.20±0.29 |
7.10±0.27 |
A1 |
7.20±0.26 |
7.30±0.24 |
7.40±0.27 |
7.30±0.25 |
7.35±0.27 |
7.37±0.27 |
A2 |
7.25±0.22 |
7.20±0.22 |
7.25±0.21 |
7.25±0.21 |
7.15±0.25 |
7.07±0.24 |
Control-Chana dal
D1- Chana dal + 25% DLP D2- Chana dal + 30% DLP A1- Chana dal + 25% ALP A2- Chana dal + 30% ALP
Pulao
Sample |
Colour |
Appearance |
Flavour |
Texture Feel |
Taste |
Overall |
Control |
8.55±0.11 |
8.55±0.11 |
8.45±0.13 |
8.55±0.11 |
8.55±0.11 |
8.50±0.11 |
D1 |
8.15±0.22 |
8.20±0.22 |
8.15±0.16 |
8.05±0.15 |
8.20±0.15 |
8.20±0.16 |
D2 |
7.55±0.26 |
7.50±0.21 |
7.75±0.19 |
7.55±0.18 |
7.60±0.18 |
7.55±0.17 |
A1 |
7.50±0.22 |
7.75±0.24 |
7.60±0.21 |
7.60±0.19 |
7.55±0.16 |
7.52±0.17 |
A2 |
6.75±0.24 |
6.95±0.28 |
6.80±0.21 |
7.00±0.23 |
6.90±0.27 |
6.85±0.23 |
CD at 5% |
0.62 |
0.63 |
0.52 |
0.51 |
0.53 |
0.49 |
Control- Rice
D1- Rice + 25% DLP
D2- Rice + 30% DLP
A1- Rice + 25% ALP A2- Rice + 30% ALP
Khichri
Sample Acceptability |
Colour |
Appearance |
Flavour |
Texture Feel |
Taste |
Overall |
Control |
8.30±0.14 |
8.40±0.11 |
8.35±0.14 |
8.40±0.13 |
8.40±0.18 |
8.28±0.12 |
D1 |
7.80±0.17 |
7.90±0.19 |
7.75±0.20 |
7.60±0.21 |
7.90±0.20 |
8.05±0.15 |
D2 |
7.15±0.21 |
7.30±0.26 |
7.40±0.25 |
8.00±0.16 |
7.35±0.24 |
7.55±0.23 |
A1 |
8.10±0.15 |
8.20±0.17 |
8.10±0.20 |
7.20±0.18 |
8.00±0.14 |
7.87±0.20 |
A2 |
7.50±0.21 |
7.25±0.22 |
7.65±0.21 |
7.75±0.20 |
7.60±0.23 |
7.37±0.25 |
CD at 5% 0.51 0.56 0.58 0.51 0.57 0.56
Control- Rice + Dhal
D1- Rice + Dal + 25% DLP D2- Rice + Dal + 30% DLP A1- Rice + Dal + 25% ALP A2- Rice + Dal + 30% ALP
DLP -Drumstick leaves powder ALP -Amaranth leaves powder
Table 2: Proximate composition of antioxidant rich products on dry weight basis (g/100g)
Dal
Products Energy (Kcal) |
Moisture |
Crude Protein |
Crude Fat |
Crude Fibre |
Total Ash |
Carbohydrate |
Control |
1.75±0.03 |
16.22±0.06 |
6.05±0.02 |
1.09±0.00 |
2.13±0.03 |
74.51417 |
D1 |
1.93±0.02 |
21.40±0.04 |
6.92±0.01 |
5.34±0.00 |
3.65±0.11 |
62.69398 |
D2 |
2.56±0.01 |
22.86±0.03 |
7.10±0.03 |
6.19±0.00 |
3.93±0.01 |
59.92395 |
A1 |
1.80±0.01 |
21.20±0.26 |
6.32±0.04 |
4.02±0.00 |
4.63±0.26 |
63.83397 |
A2 |
2.36±0.05 |
21.59±0.19 |
6.45±0.01 |
4.69±0.00 |
5.10±0.45 |
62.17393 |
CD at 5% |
0.06 |
0.55 |
NS |
0.18 |
NS |
-- |
Control-Chana dal
D1- Chana dal + 25% DLP
D2- Chana dal + 30% DLP A1- Chana dal + 25% ALP A2- Chana dal + 30% ALP
Pulao
Products Energy (Kcal) |
Moisture |
Crude Protein |
Crude Fat |
Crude Fibre |
Total Ash |
Carbohydrate |
Control |
2.51±0.01 |
5.20±0.19 |
5.70±0.09 |
0.14±0.01 |
1.5±0.07 |
87.46421 |
D1 |
2.90±0.01 |
10.84±0.04 |
6.52±0.04 |
4.39±0.02 |
3.02±0.01 |
75.23402 |
D2 |
3.74±0.02 |
11.20±0.07 |
6.72±0.04 |
5.24±0.03 |
3.30±0.19 |
73.54399 |
A1 |
2.55±0.01 |
9.23±0.03 |
6.01±0.04 |
3.14±0.01 |
4.10±0.09 |
77.52401 |
A2 |
3.02±0.03 |
11.02±0.02 |
6.09±0.04 |
3.74±0.01 |
4.60±0.09 |
74.55397 |
CD at 5% |
0.05 |
0.36 |
0.03 |
0.19 |
0.05 |
-- |
Control- Rice |
|
|
|
|
|
|
D1- Rice + 25% DLP D2- Rice + 30% DLP
A1- Rice + 25% ALP
A2- Rice + 30% ALP
Khichri |
Moisture |
Crude Protein |
Crude Fat |
Crude Fibre |
Total Ash |
Carbohydrate |
Energy (Kcal) |
|
|
|
|
|
|
Control |
1.73±0.01 |
6.66±0.09 |
4.75±0.04 |
0.21±0.01 |
2.07±0.09 |
86.31414 |
D1 |
2.09±0.00 |
11.53±0.13 |
5.62±0.04 |
4.46±0.03 |
3.59±0.39 |
74.80395 |
D2 |
2.90±0.01 |
12.71±0.04 |
5.81±0.09 |
5.31±0.02 |
3.87±0.09 |
69.29380 |
A1 |
2.00±0.01 |
11.42±0.01 |
5.05±0.09 |
3.21±0.02 |
4.57±0.04 |
75.75394 |
A2 |
2.48±0.02 |
12.59±0.04 |
5.12±0.04 |
3.80±0.01 |
5.02±0.04 |
73.47390 |
CD at 5% |
0.02 |
0.10 |
0.07 |
0.20 |
0.19 |
-- |
Control- Rice + Dhal DLP- Drumstick
leaves powder
D1- Rice + Dal + 25% DLP ALP- Amaranth leaves powder D2- Rice + Dal + 30% DLP
A1- Rice + Dal + 25% ALP
A2- Rice + Dal + 30% ALP
Values are Mean ±SE NS - Non Significant
Table 3. Vitamins content of antioxidant rich products (dry matter basis)
Product |
Vitamin C (mg/100g) |
?-carotene (µg/100g) |
DalControl |
1.05±0.15 |
110.74±0.03 |
Pulao |
|
|
Control |
1.4±0.19 |
0.04±0.02 |
Khichri |
|
|
Control |
1.8±0.1 |
0.07±0.00 |
Values are Mean ±SE
Article Information
Sr No: 1
Page No: 01-07
Size:
Download:
Cited By:
Language: English
Licence: IJW
Authors: Shalini Kushwaha*, Paramjit Chawla
Authors Address: *Assistant Professor, Department of Food Science and Technology Babasaheb Bhimrao Ambedkar University, Lucknow-226002
Email: shalinikushwaha72@gmail.com
Published: 14 November, 2014